Real-time transparency
in the warehouse in SAP EWM

Intuitive dashboards to
increase performance in the warehouse

LP EasyDashboard for more transparency in the warehouse in SAP EWM.
In real time. Out-of-the-box. Browser-based.

What the LP EasyDashboard add-on offers

Processes in the warehouse are very different, complex and often not transparent. For example, it is often not known how many open stock movements are in the goods receipt zone. This is exactly where our LP EasyDashboard add-on comes in.

It offers the possibility of a real-time visualisation of key performance indicators (KPIs) from the different warehouse areas – from goods receipt to inventory management to goods issue.

We deliver our solution with various visually very appealing standard dashboards. These summarise the most important key figures from the warehouse. In addition, completely customised dashboards can be created, which are adapted to the processes and requirements of the customers.

The dashboards generated online are displayed browser-based. And this can be done on any end device – from a Smart TV as a large monitor directly in the warehouse, to a PC, to the mobile phone of the warehouse manager, for example. 

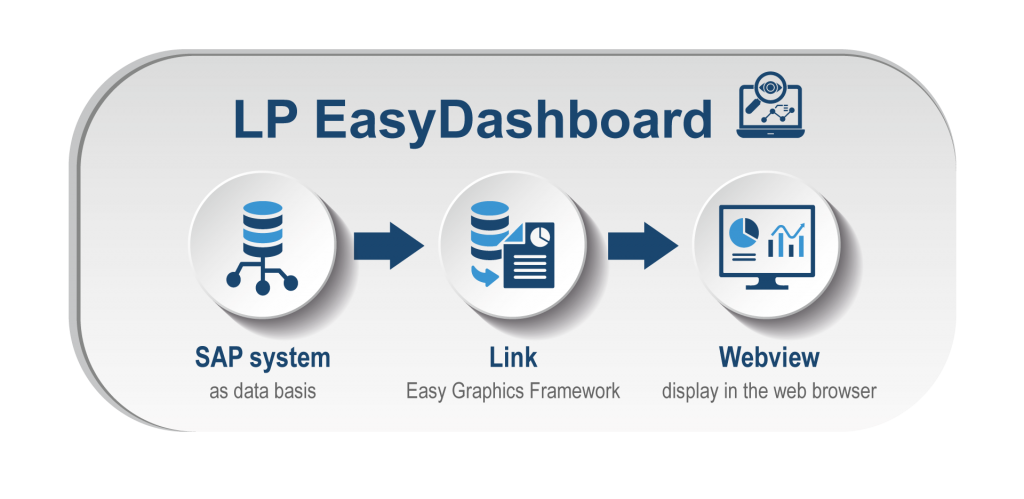
For the generation of the cockpit charts, we use the SAP standard tool Easy Graphics Framwork (EGF). This gives us the advantage that we can tap into various SAP standard data sources (SAP EWM monitor, key figure services), but also individual data sources (e.g. CDS).

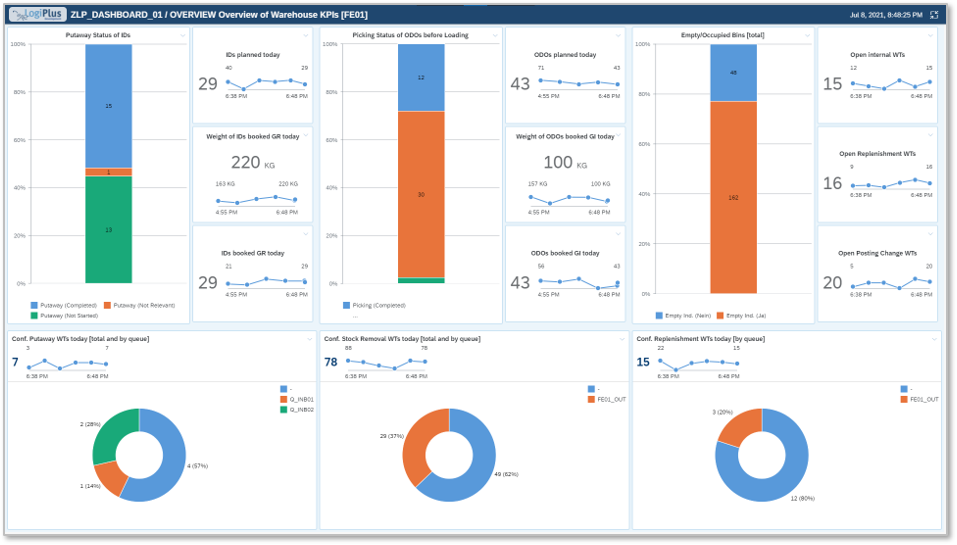
  •  Overview Charts

    Overview Charts

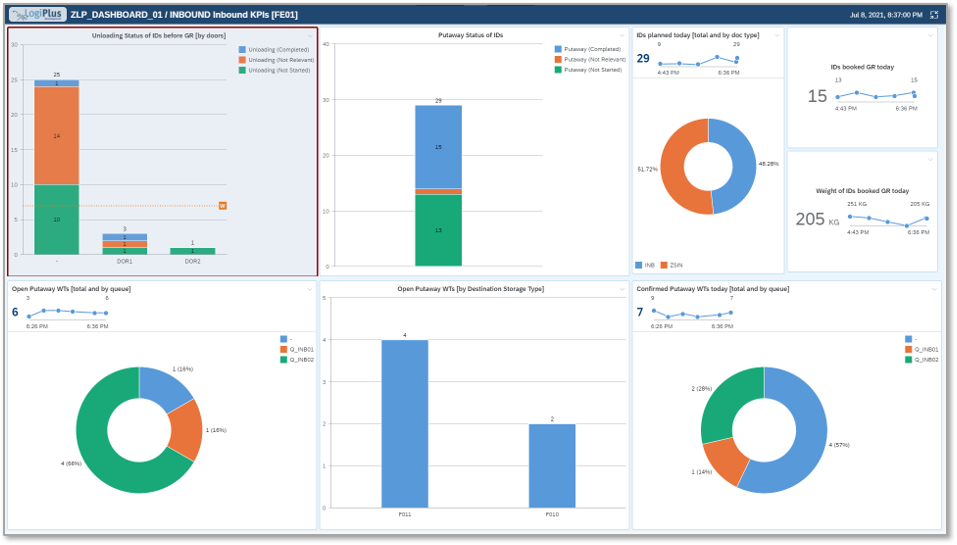
  •  Inbound Charts

    Inbound Charts

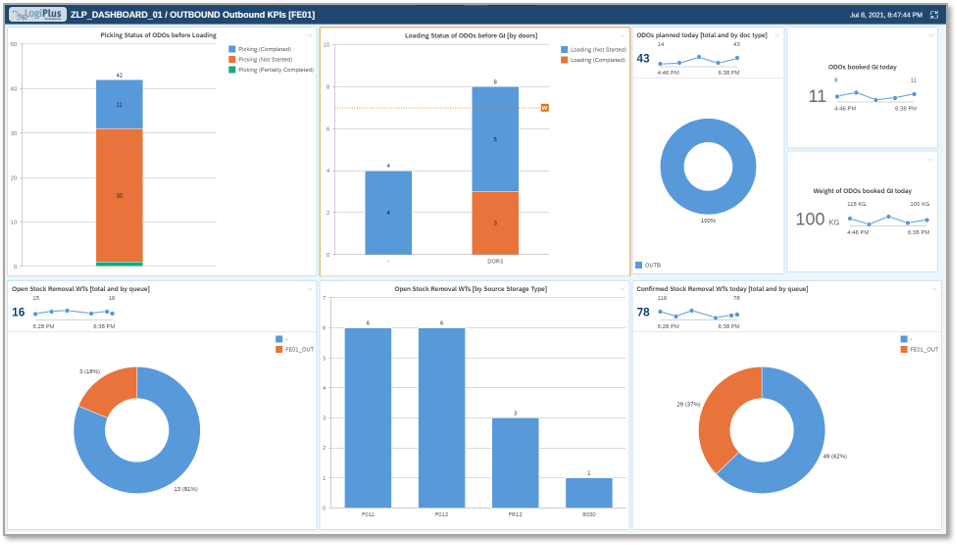
  •  Outbound Charts

    Outbound Charts

  •  Internal Charts

    Internal Charts

Device Slider

Online live demo
LP EasyDashboard

You would like to get to know our add-on in order to assess how you can optimise your logistics processes with it? Then take the chance and request an online live demo.

Which standard dashboards does
LP EasyDashboard offer?

Overview charts

  • Aggregation of important charts in the areas of Inbound, Outbound and Internal
  • Important for a quick overview of all areas that are relevant for the warehouse
  • Elementary basis for higher-level functions in order to be able to make the right decisions

Inbound

  • How many deliveries can be expected in a predefined period? Decision support for door occupancy
  • How many open LBs are in the goods receiving zone? Help with work/resource planning
  • How many HUs have been received in a predefined period (number, weight)? Employee motivation

Outbound

  • How many HUs were shipped in a predefined period, e.g. (number, weight)?

  • How many open/completed picks are there in a predefined period of time?

  • Which overdue HUs have already been in the goods issue area and for how long? Tracking of the backlog

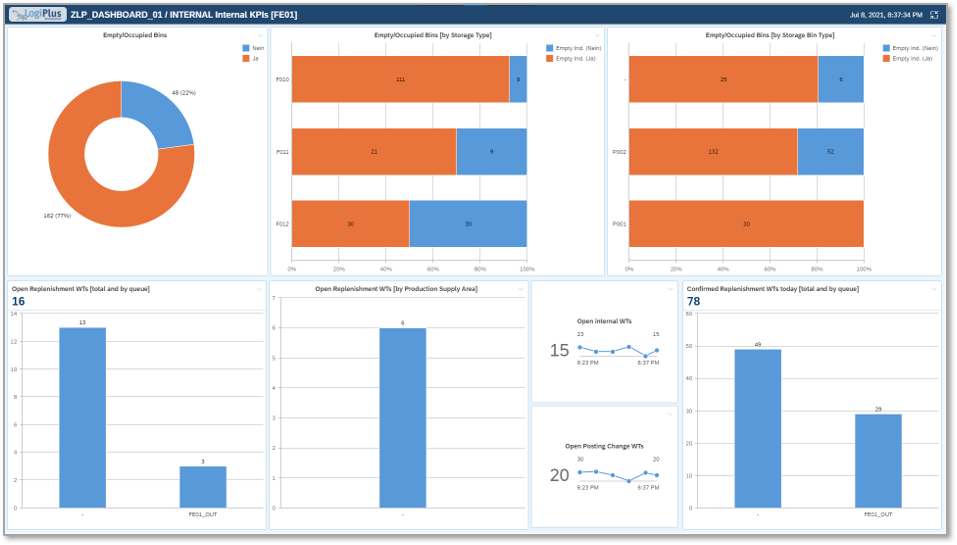
Internal charts

  • Charts that show, for example, the occupancy of the storage bins: how many bins are occupied and how many are empty?

  • Display in general and categorised, e.g. according to storage bin type

  • How many HUs are in the warehouse?

  • Display of all open and confirmed replenishment processes

Advantages of LP EasyDashboard

Display of the data in real-time

Layout flexible, modern and intuitive. Fiori “look & feel” possible (even without SAP Analytics Cloud or S/4HANA)

Web-based display on any end device with a browser (desktop, smart TV, mobile phone) – without SAP installation!

Pre-built dashboards with the required KPIs

Dashboards can be extended as required

Platform-independent, as it is a web application: Windows, Apple and Android

Several key figures can be displayed in one chart

Dashboard creation target group specific (warehouse manager, warehouse control centre etc.)

Low installation effort

Easy customisation of dashboards according to your requirements

Use of different data sources possible

Operation of the dashboard without additional SAP knowledge

LP EasyDashboard:
What graphical possibilities exist?

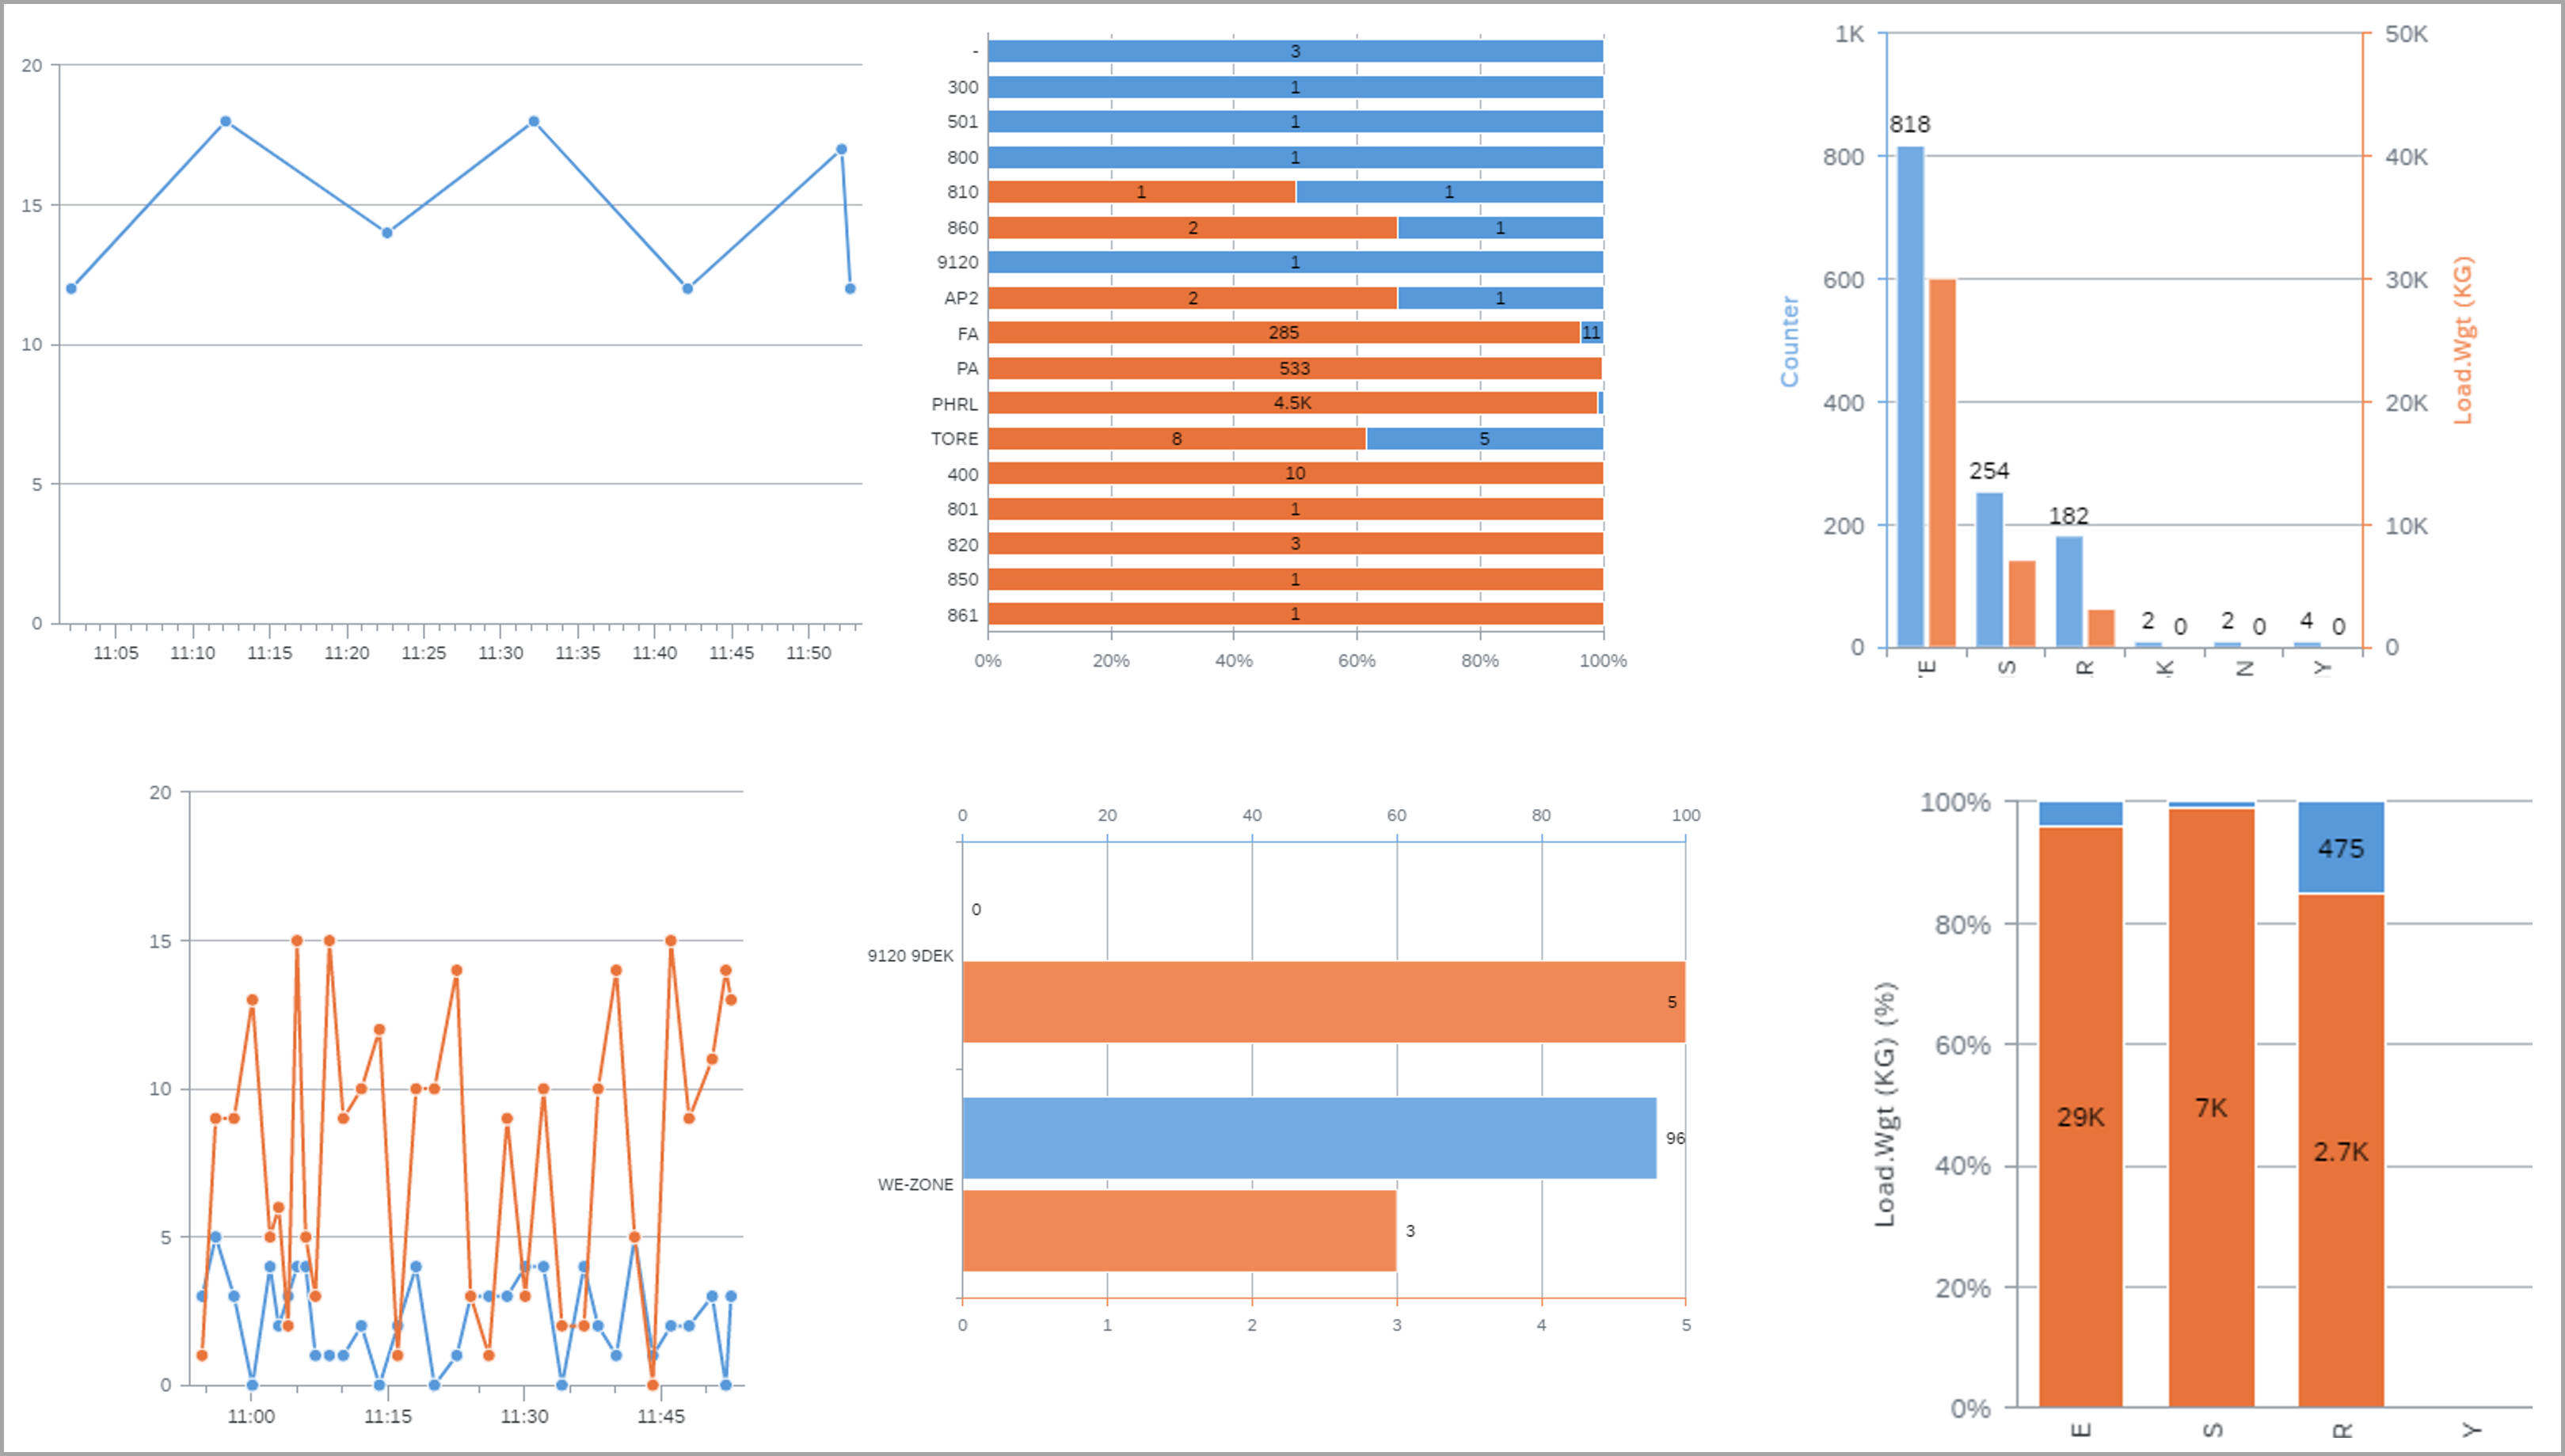
Use of all common chart types possible

Individual representation in the individual charts

  •  Line, bar or <br>column charts

    Line, bar or
    column charts

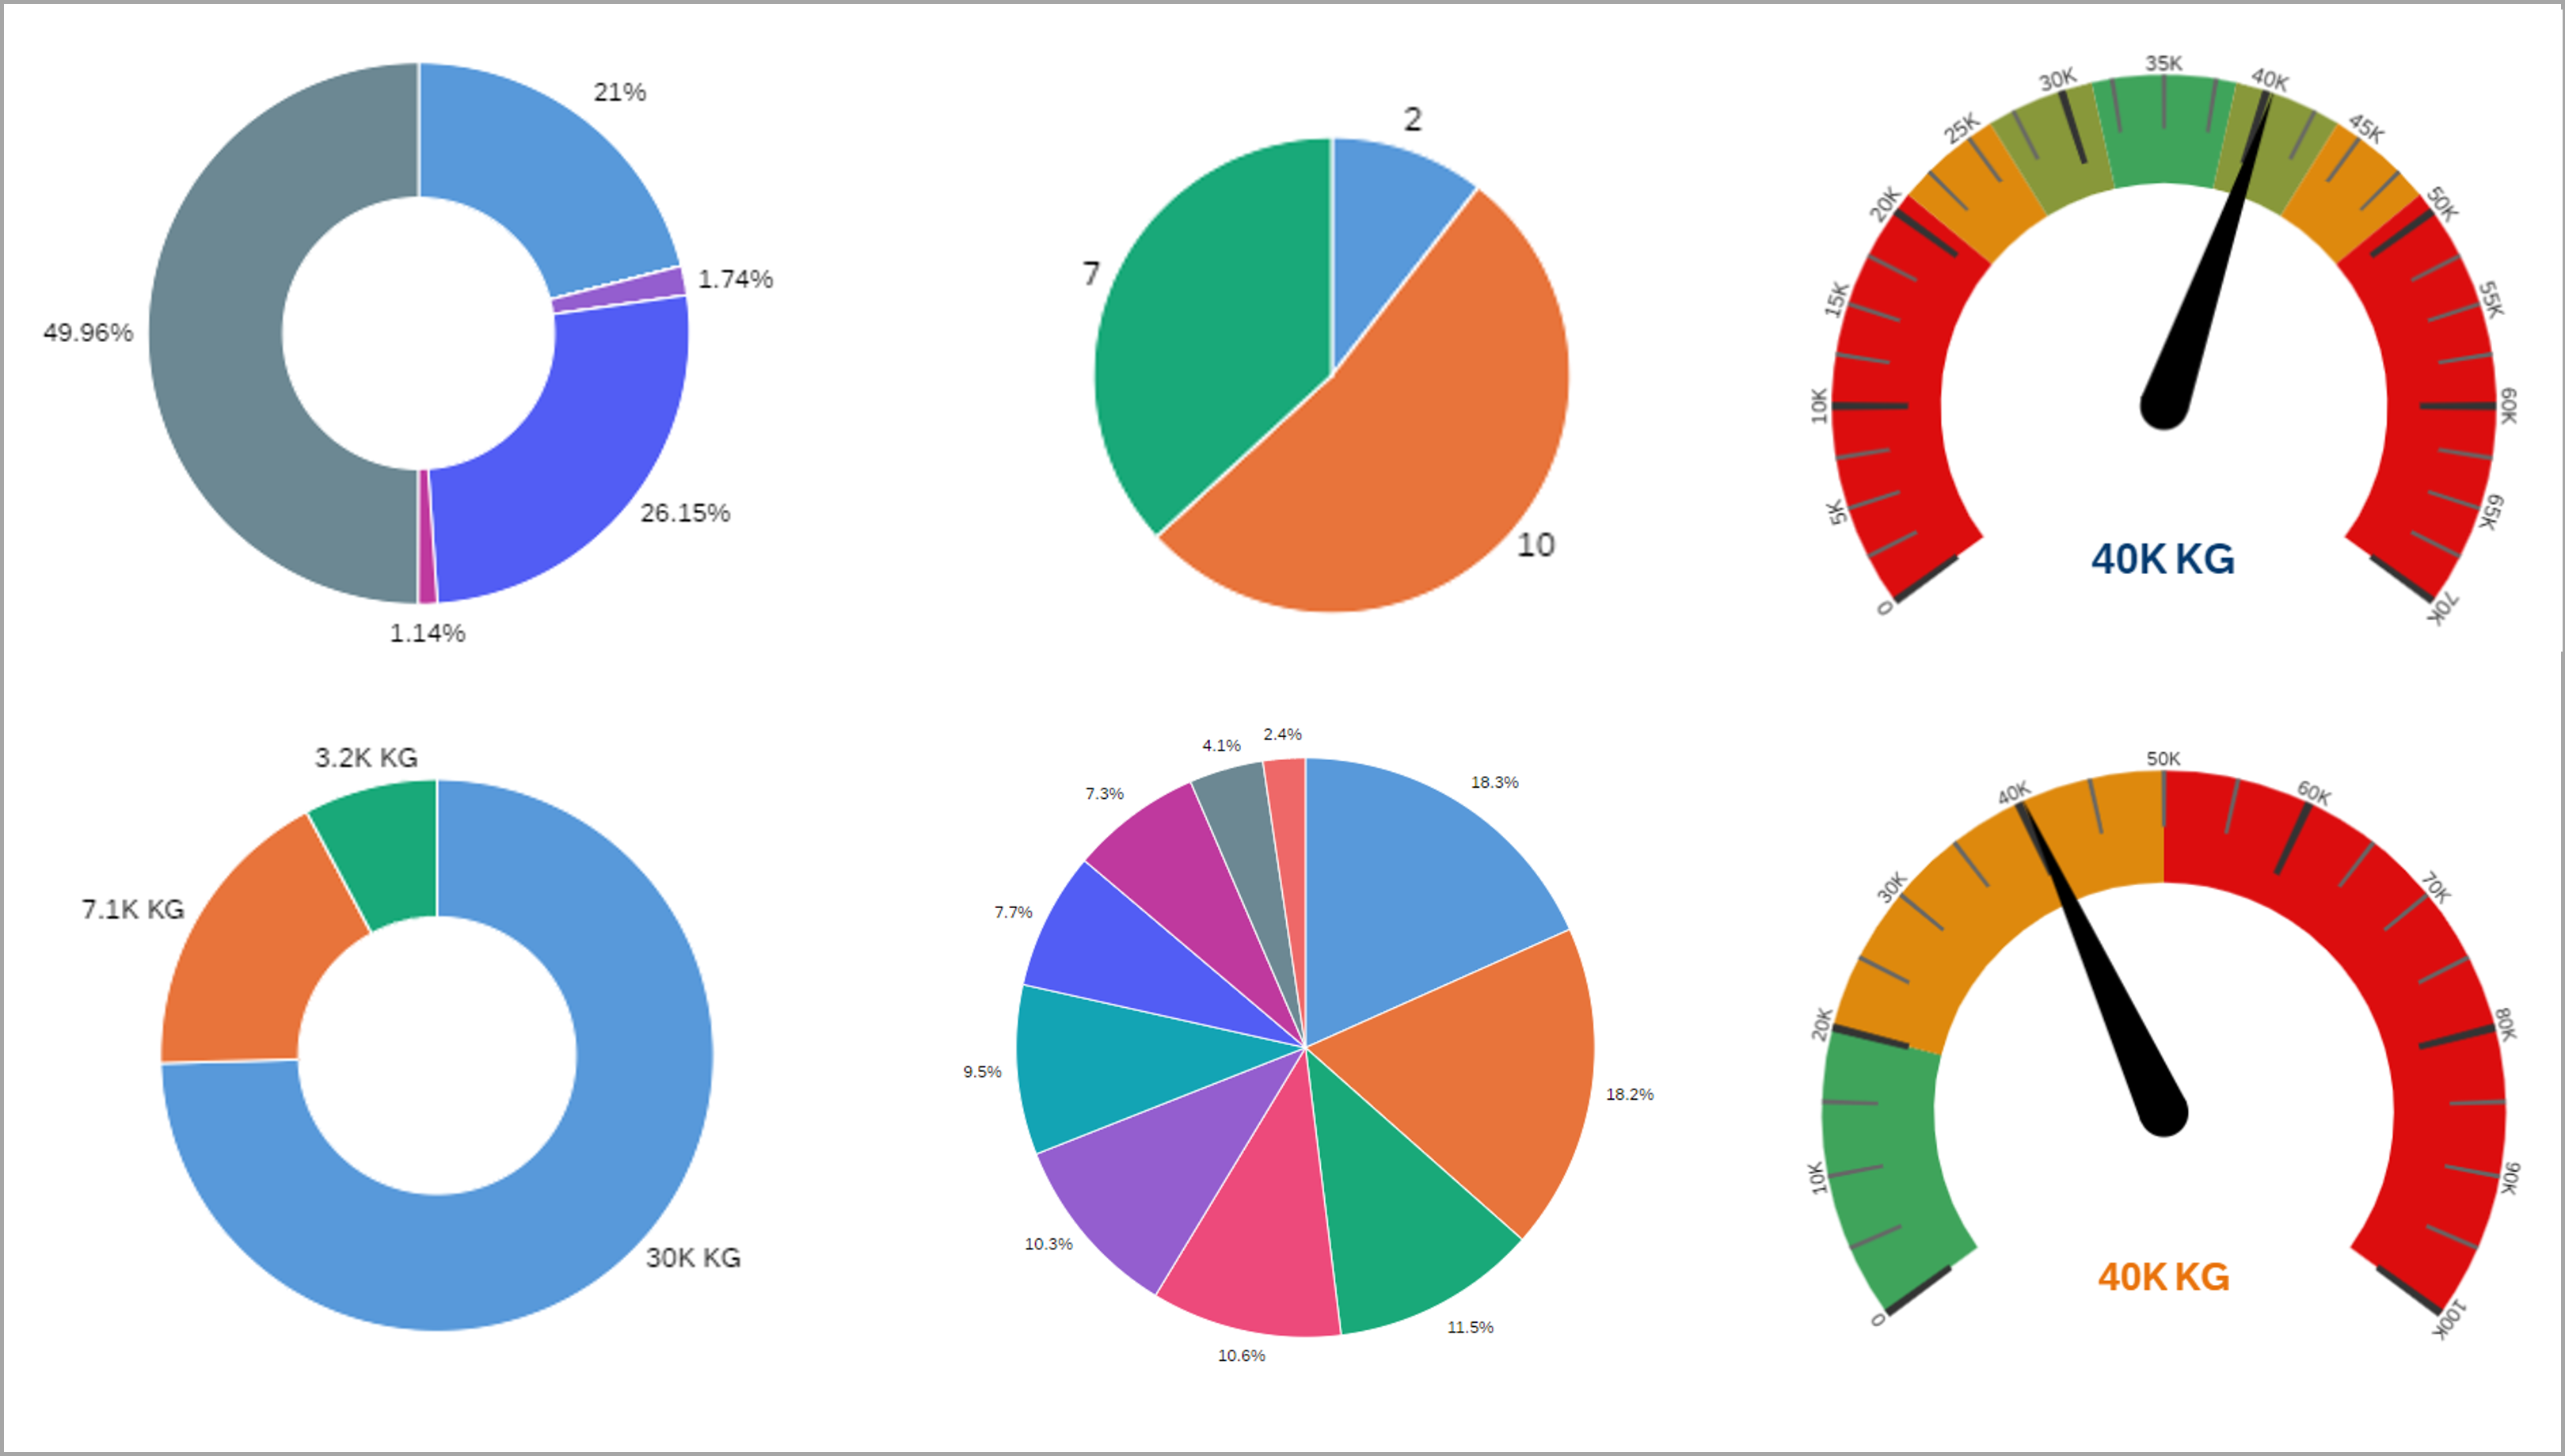
  •  Ring or pie charts,<br>Tachometer display

    Ring or pie charts,
    Tachometer display

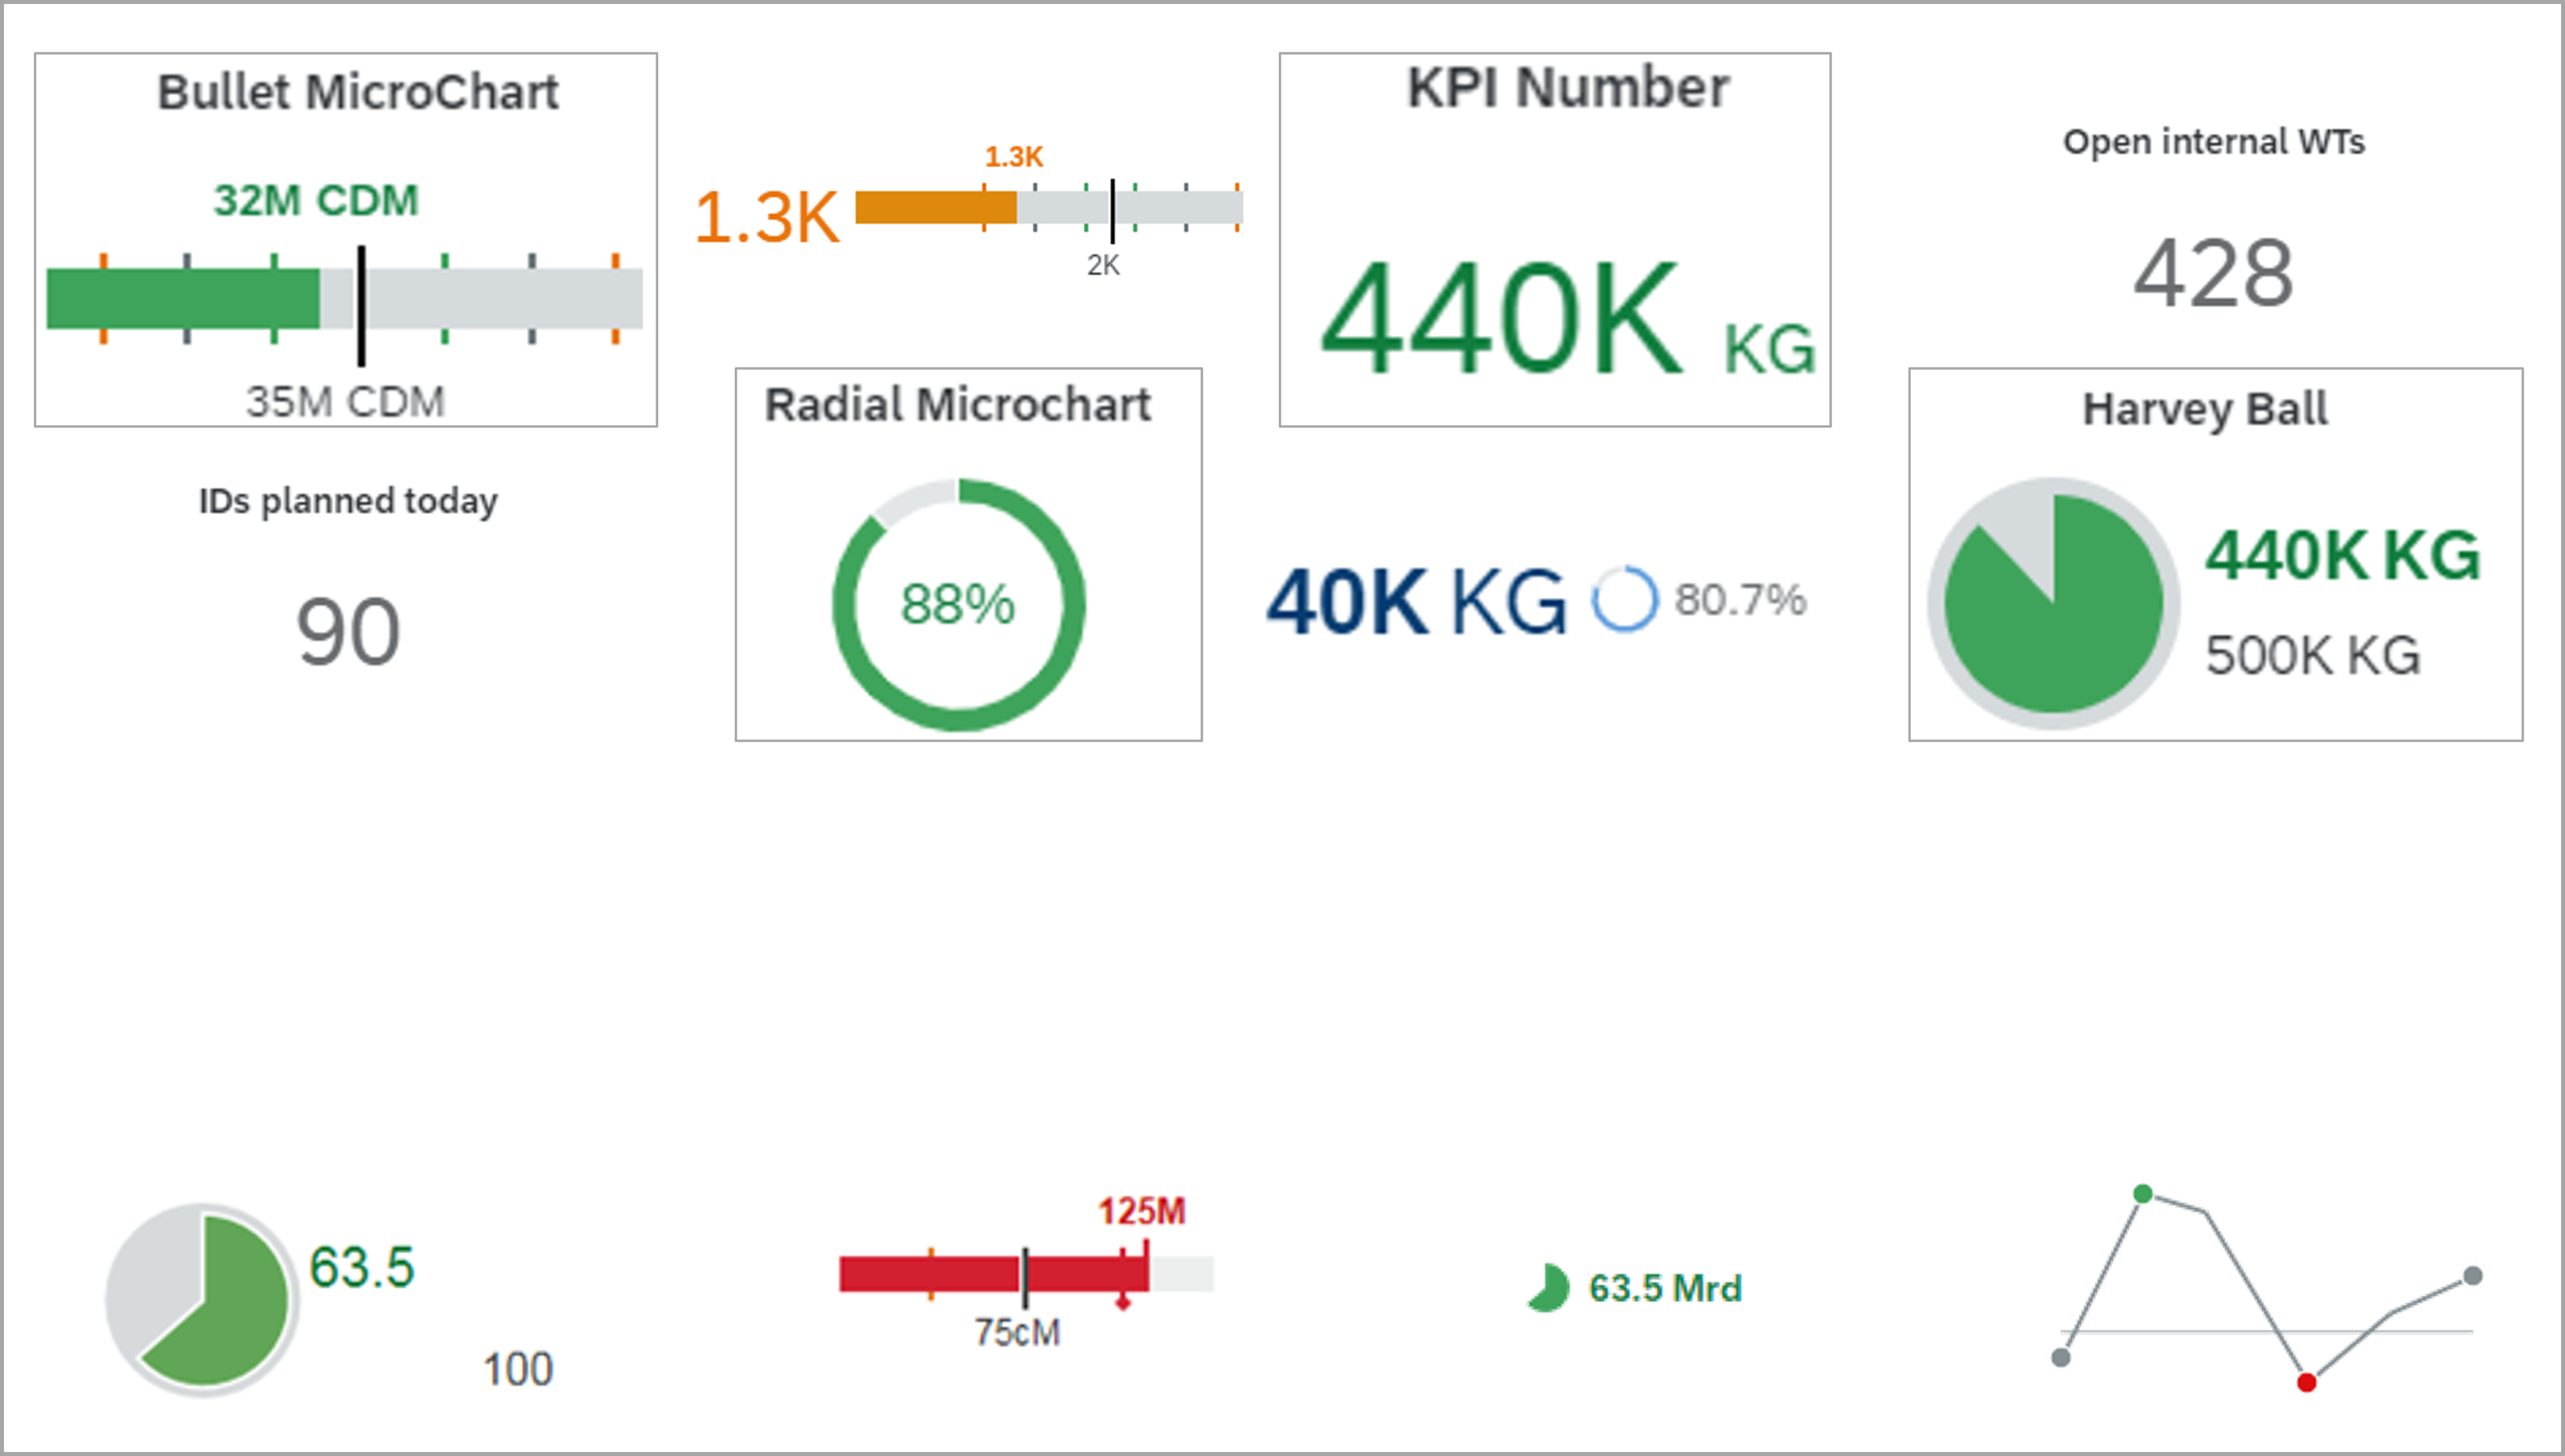
  •  Micro charts

    Micro charts

  •  Cards as a combination <br>of charts and micro-charts

    Cards as a combination
    of charts and micro-charts

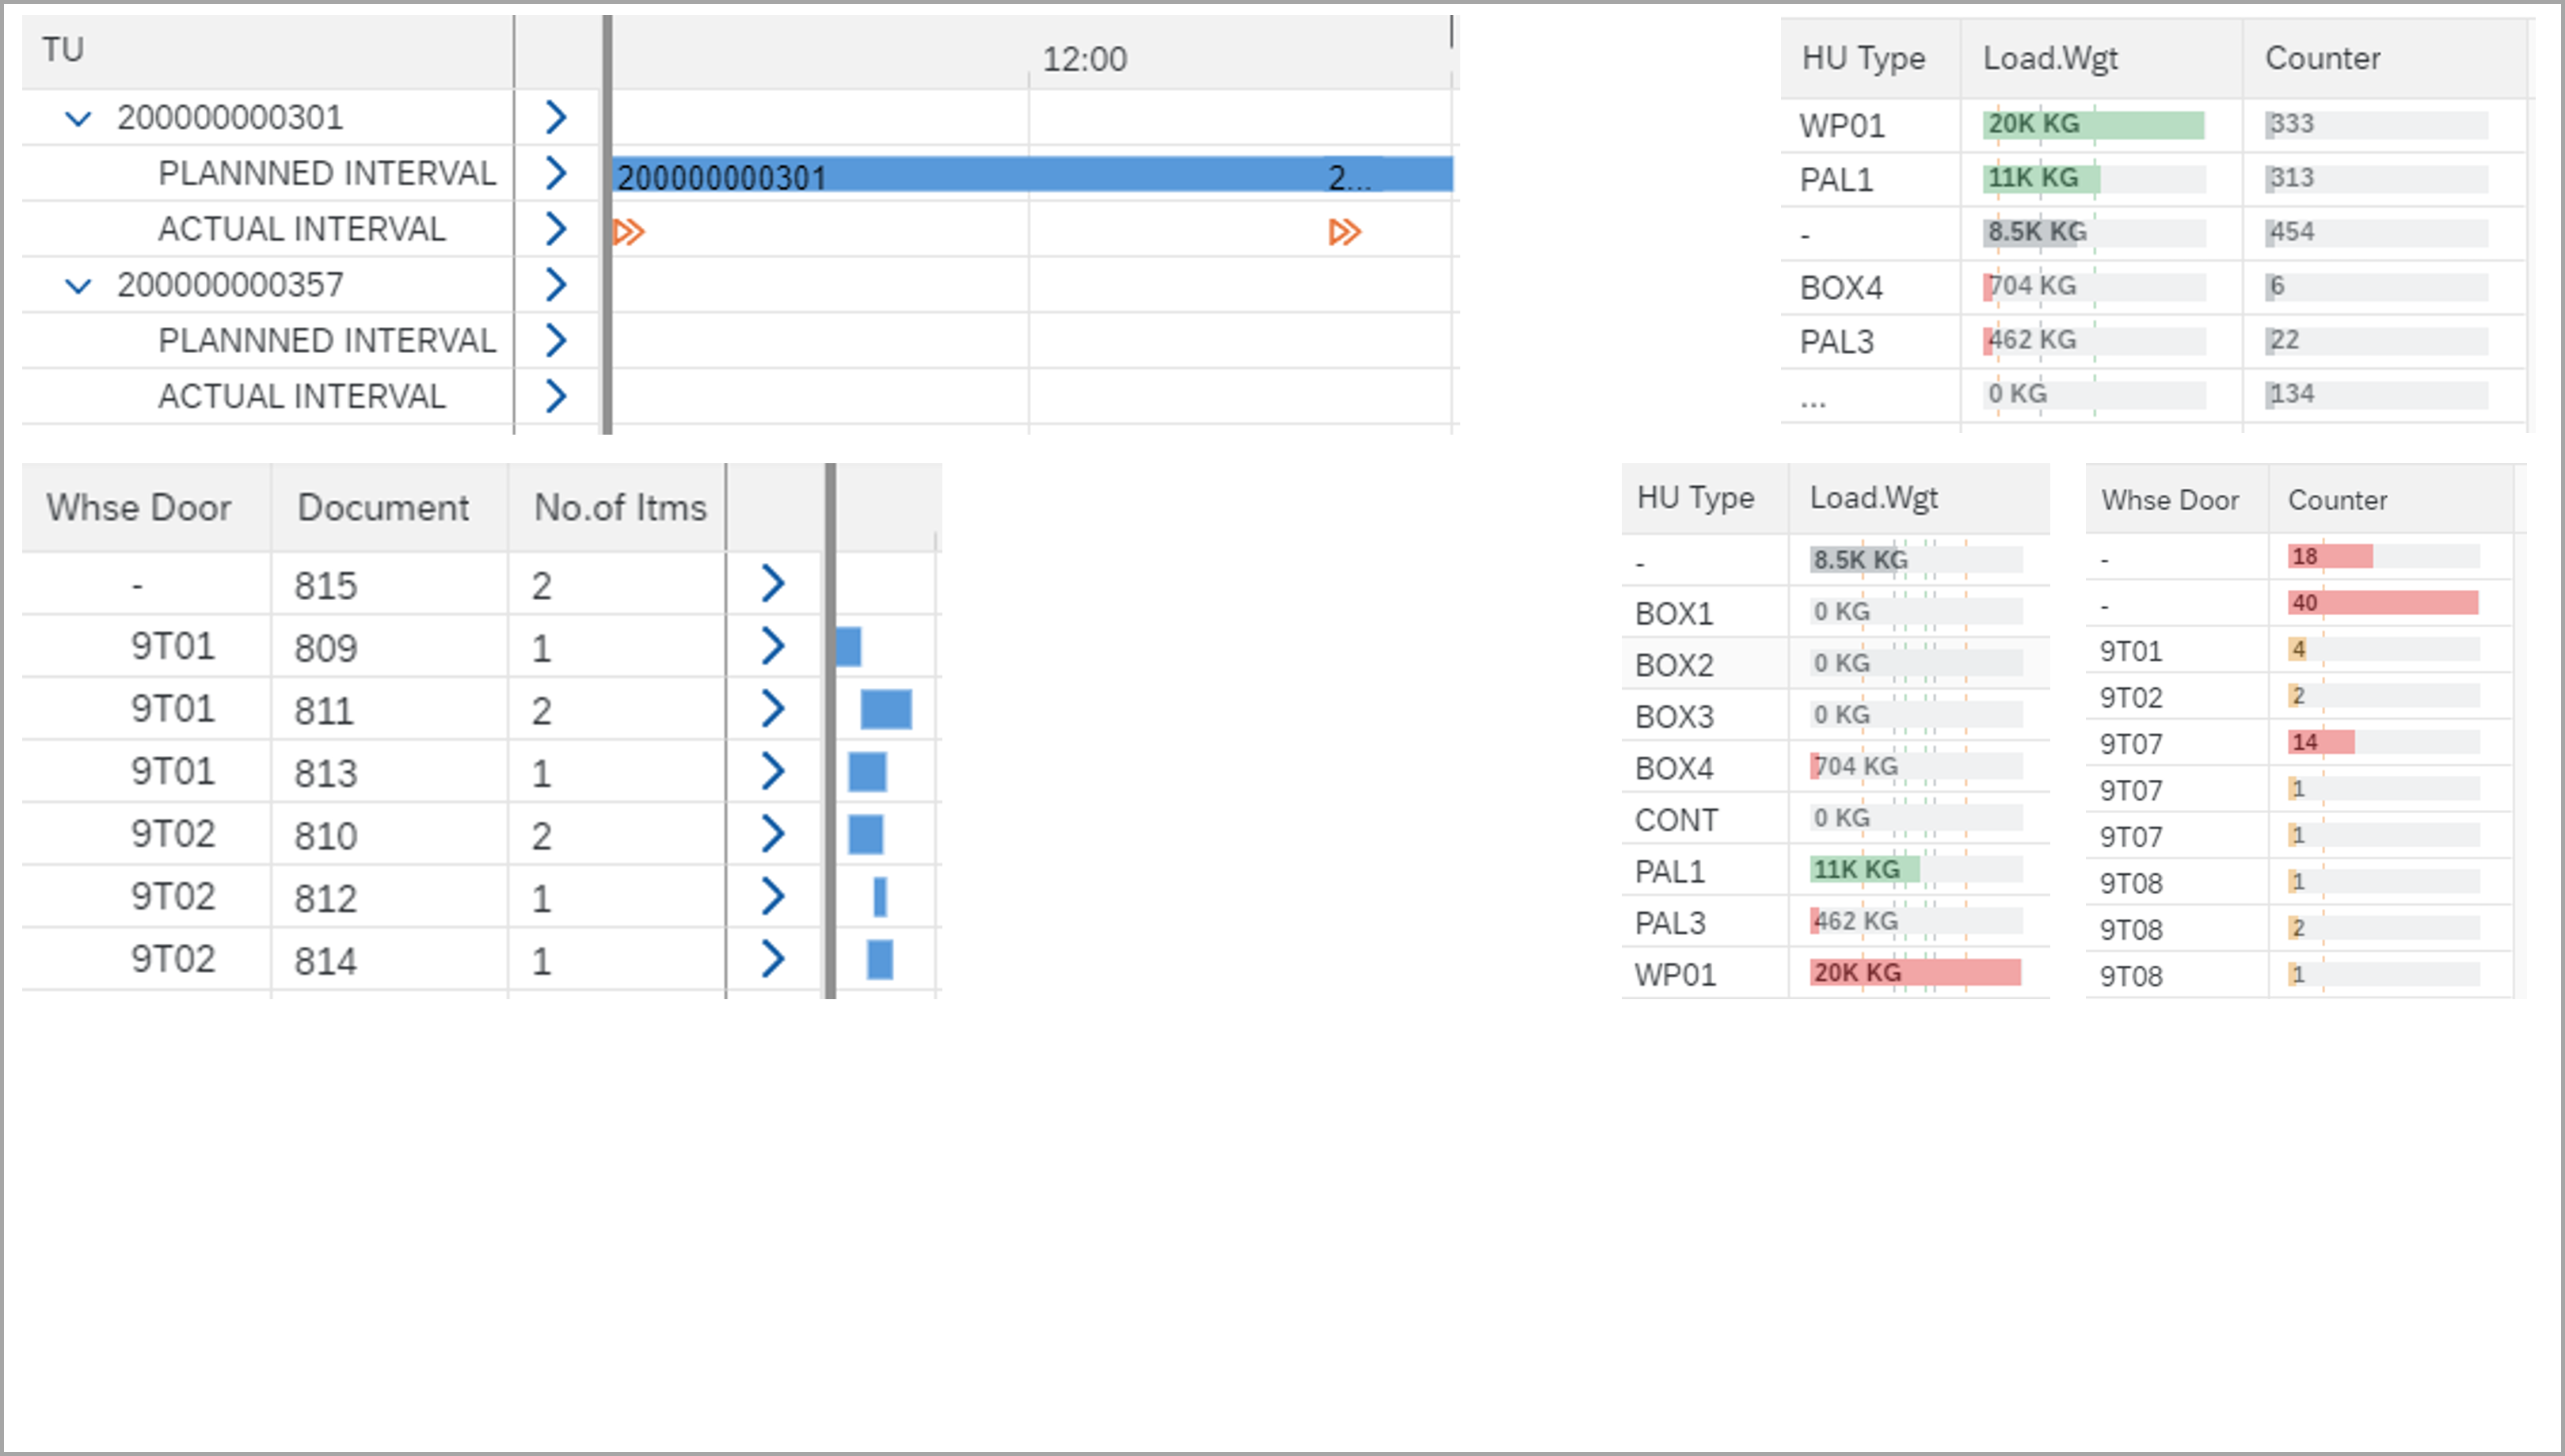
  •  Gantt charts, tables

    Gantt charts, tables

Device Slider

Further topics around SAP EWM

Rapid Deployment Solution LP PoweredEWM

Implement a fully fledged SAP EWM system in record speed! Our Rapid Deployment Solution offers predefined processes and extensions. These lead to a significantly shortened implementation phase. Thanks to these time savings, a significant cost reduction is possible.

SAP EWM on demand for temporary warehouses

The all-inclusive package for SAP EWM offers all services from a single source – from implementation, licences, maintenance, hardware procurement to hosting, support and application management. And you can even rent all this instead of buying it and get predictable, manageable operational costs.

Online Live-Demo anfragen

You are currently viewing a placeholder content from HubSpot. To access the actual content, click the button below. Please note that doing so will share data with third-party providers.

More Information
LP EasyDashboard Produkt-Broschüre jetzt öffnen

You are currently viewing a placeholder content from HubSpot. To access the actual content, click the button below. Please note that doing so will share data with third-party providers.

More Information
Contact

You are currently viewing a placeholder content from HubSpot. To access the actual content, click the button below. Please note that doing so will share data with third-party providers.

More Information
Request online live demo

You are currently viewing a placeholder content from HubSpot. To access the actual content, click the button below. Please note that doing so will share data with third-party providers.

More Information
LP EasyDashboard product brochure

You are currently viewing a placeholder content from HubSpot. To access the actual content, click the button below. Please note that doing so will share data with third-party providers.

More Information